Benchmarking LLM Performance: Token Per Second (TPS), Time to First Token (TTFT), and GPU Usage
Evaluate and plan your LLMs infrastructure requirements for production deployment.

Content Outline
- Need of LLMs Performance Benchmarking
- Understanding the Key Performance Metrics :
- Token Per Second (TPS)
- Time to first token (TTFT)
- GPU Usage
- Let’s Actually Benchmark an LLM — A Real Example with Code
- Things to Watch Out for During Performance Testing
- Conclusion
Need of LLMs Performance Benchmarking

LLMs, despite their impressive capabilities, come with high computational costs. Before selecting and using a new model, like a 12B parameter version, it’s important to first look at how much it will cost to run in production. The real goal isn’t just to fine-tune the latest models, but to deploy them efficiently and create actual value.
We need to plan our infrastructure before we start training or fine-tuning. Performance benchmarking helps us figure out exactly what computing resources we’ll need and how to best use them.
This article covers the key metrics you need to estimate infrastructure (GPU mainly) to run LLM and what to look for when benchmarking these models. These insights will help you make better choices about what resources you’ll need to run the given model in production.
Understanding the Key Performance Metrics
Running LLMs in production comes down to one main thing — how fast can you get responses from your model (besides accuracy, obviously!). To get the fastest responses, you need solid infrastructure (GPUs and such), but let’s be real — you can’t just pick the fanciest GPU out there. You need to find something that fits your budget.
To figure out what infrastructure you’ll need for your LLM deployment without breaking the bank, let’s look at some key metrics that’ll help you make the right choice:
Time to first token (TTFT)
It refers to the amount of time an LLM takes to generate the first token in its response after receiving an input or prompt. It is typically measured in seconds or milliseconds, and a lower TTFT indicates faster model responsiveness.
Why TTFT Matters for Performance Benchmarking?
TTFT is a key metric for understanding a model’s responsiveness, especially when input complexity varies. It helps benchmark how efficiently the model handles different types of inputs.
Token Per Second (TPS)
TPS refers to the number of tokens that a LLM can generate or process in one second. A higher TPS indicates faster model responses.
TPS is generally calculated using the formula:
TPS = (Input Tokens + Output Tokens) / Total Turnaround Time (TAT in seconds)
This value represents the average TPS, accounting for both the input and output tokens over the total time taken.
However, it’s also important to evaluate Output TPS, which specifically measures how many tokens the model generates per second, independent of the input tokens.
Output TPS can be calculated as:
Output TPS = Output Tokens / Time to Generate Output Tokens (TAT in seconds)
Output TPS is a more focused metric that excludes input token processing. It provides a clear measure of the model’s raw generation speed, offering insights into how efficiently the model produces output regardless of the complexity or size of the input.
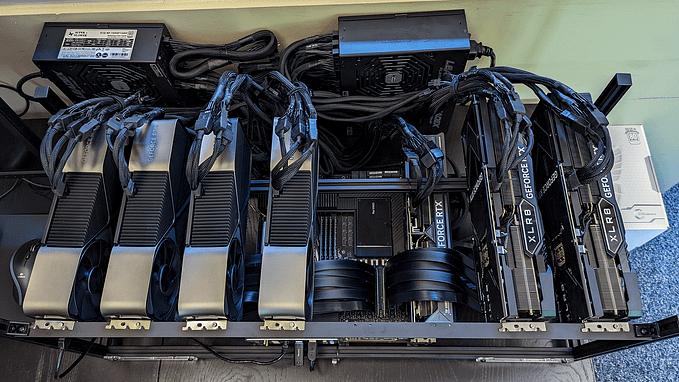
GPU Usage
GPU usage benchmarking is critical for two main reasons: it helps you avoid performance bottlenecks in production and ensures you’re not overpaying for unused resources. Without proper GPU benchmarking, you might end up with a model that either crashes due to insufficient resources or wastes money on underutilized hardware.
When measuring GPU usage, we look at two key metrics:
Volatile GPU Utilization (0–100%) :
This shows how hard your GPU is working during model inference. Think of it like your GPU’s ‘effort level’ — it sits at 0% when idle and ramps up as the model generates output. We need to know:
- What percentage of GPU power the model typically uses
- How utilization varies with different batch sizes and input lengths
- Peak utilization during heavy loads
GPU Memory Usage:
This tells us how much VRAM your model needs. It’s crucial to measure:
- Base memory required just to load the model (idle state)
- Peak memory usage during generation
- Memory patterns with different input sizes
- How memory usage scales with batch processing
Understanding both metrics helps you right-size your infrastructure and avoid nasty surprises in production like out-of-memory errors or performance degradation.
Using these metrics (TTFT, TPS, and GPU usage) together helps us make a smart comparison between different GPUs and infrastructure options. This way, we can pick the setup that gives us the best performance for our specific use case without overspending.
👉🏼 Let’s look at a real example to show you how to use these metrics to figure out exactly what GPU setup you’ll need for your model.
Let’s Actually Benchmark an LLM — A Real Example

Say you’ve got your eyes on LLAMA 3.1 1B and want to figure out if you can actually afford to run it in production. Let’s walk through how to test this properly.
First Up: Create Your Test Data Before diving into any testing, you need a solid benchmark dataset. This isn’t just random data — it should look exactly like what you expect in production:
- Got users who’ll send in massive documents? Include 10k token inputs
- Expecting quick queries? Throw in some short prompts
- Mix in different complexity levels (simple questions, complex analysis, etc.)
- Add edge cases that might break things
The Testing Process:
1. Set Up Your Testing Environment
- Start with a basic but decent GPU (T4 16GB works well for smaller models like 3B or 8B)
- Clean environment with no other processes hogging resources
2. Run Your Benchmarks You’ll need a good benchmark script for this (I’ve got one ready to share with you).
3. Collect Your Metrics Here’s what you really need to measure:
- TTFT: Get that time-to-first-token (how fast your model starts responding)
- TPS: Look at both input+output and output-only speeds
- GPU Usage:
- How much memory you need just to load the model
- Peak memory during generation
- GPU utilization (how hard your GPU is working)
4. Do The Math : Now’s when you figure out the real costs:
- Calculate cost per token
- Scale it up to see what 10 million tokens would cost you
5. Test Different GPUs
- Repeat the whole process with different GPU types
- Keep track of cost vs speed tradeoffs
- Note any stability issues or errors
6. Make Your Decision : Look at all your data and find your sweet spot:
- Fast enough to keep stakeholders happy?
- Cheap enough to not blow your budget?
- Stable enough for production?
Next up, I’ll show you a benchmark script that makes all this testing way easier. You can use it as-is or tweak it for your specific needs.
Let’s Break Down the Benchmarking Code :
Let’s walk through a real implementation of how to benchmark your LLM. I’ll show you two main components: GPU monitoring and performance metrics tracking.
i. GPU Monitoring with GPUMonitor Class
First up, we need to track how our GPU behaves during inference. Here’s a custom GPUMonitor class that does this job:
class GPUMonitor:
    def __init__(self, monitoring_interval: float = 0.1):
        self.monitoring_interval = monitoring_interval
        self._gpu_memory_usage = []
        self._gpu_utilization = []
        self._is_monitoring = False
Things this class does:
- Runs in the background using a separate thread (won’t slow down your model)
- Samples GPU metrics every 0.1 seconds
- Tracks both memory usage and GPU utilization
- Gives you peak and P90 metrics
Using it is super simple:
gpu_monitor = GPUMonitor()
gpu_monitor.start()
# Run your model here
gpu_monitor.stop()
metrics = gpu_monitor.get_peak_usage()  # get your metrics
ii. Performance Metrics Tracking
We’ve got two main functions that work together:
benchmark_single_prompt: This is your workhorse function. For each prompt, it:
- Tracks time to first token (TTFT)
- Measures tokens per second (TPS)
- Records GPU usage during generation
- Handles streaming generation (great for real-world scenarios)
Key metrics it collects:
benchmark_results = {
    'time_to_first_token_seconds': first_token_time,
    'tokens_per_second': total_tokens / total_generation_time,
    'output_decode_tokens_per_second': output_tokens / generation_time,
    'peak_gpu_memory_mb': peak_gpu_usage,
    'p90_gpu_utilization': p90_gpu_utilization
    # ... and more
}benchmark_language_model: This is your orchestrator. It:
- Runs multiple prompts through the single prompt benchmarker
- Aggregates all the results
- Gives you P50 and P90 metrics for everything
Putting It All Together Here’s how you’d use this in practice:
# Load your model and tokenizer
model = AutoModelForCausalLM.from_pretrained("your-model")
tokenizer = AutoTokenizer.from_pretrained("your-model")

# Your test prompts
test_prompts = [
    "Short prompt",
    "Medium length prompt with more context",
    "Really long prompt..." # Add your real-world examples
]

# Run the benchmark
results = benchmark_language_model(
    model=model,
    tokenizer=tokenizer,
    prompts=test_prompts,
    temperature=0.7,
    max_new_tokens=100
)

# Check your results
print(f"P90 TPS: {results['p90_total_tps']}")
print(f"P90 TTFT: {results['p90_ttft_seconds']} seconds")
print(f"Max GPU Memory: {results['max_gpu_memory_mb']} MB")
Benchmark Results Example:
Here’s what you’ll get when you run the benchmark script — a clear snapshot of your model’s performance:
{
    'p50_total_tps': 41.02,      # Median tokens per second (input + output)
    'p90_total_tps': 45.978,     # 90th percentile TPS (input + output)
    'p50_decode_tps': 27.151,    # Median output generation speed
    'p90_decode_tps': 32.486,    # 90th percentile output generation speed
    'p50_ttft_seconds': 0.002,   # Median time to first token
    'p90_ttft_seconds': 0.093,   # 90th percentile response time
    'max_gpu_memory_mb': 1445.0, # Peak GPU memory used
    'p90_gpu_memory_mb': 1445.0, # 90th percentile memory usage
    'max_gpu_utilization': 63.0, # Peak GPU utilization percentage
    'p90_gpu_utilization': 61.2  # 90th percentile GPU usage
}
These metrics tell you exactly how your model performs: it processes about 41 tokens per second on average, starts responding in under 0.1 seconds, and uses about 1.4GB of GPU memory. Pretty neat, right?
Pro Tips:
- Always test with real-world prompts
- Run multiple iterations for reliable results
- Watch out for memory spikes with long inputs
- Don’t forget to clean up GPU memory between runs
✅ Need the full code ? Find it here :
I’ve put together a complete example of benchmarking LLAMA 3.1 1B model in a Colab notebook, check out the full benchmark example here:
https://colab.research.google.com/drive/1OTf3v3kJepj7j_XwIQDrNTdKjxbbR1V-?usp=sharing
Things to Watch Out for During Performance Testing

Watch Those Tokenizers — They’re Trickier Than You Think
Different tokenizers can mess with your benchmarks big time. For example, SentencePieceTokenizer might create 20–30% more tokens than TikTokenTokenizer for the exact same input.
Think about it — if TikToken gives you 10k tokens, SentencePiece might give you 12k! This directly affects your performance metrics, so you need to factor this in when comparing models.
Input Size Can Break Your GPU
Don’t just test with standard-sized inputs — that’s a rookie mistake. If you only benchmark with small inputs but then hit your model with a massive prompt in production, you might run into out-of-memory errors.
Test with:
- Tiny inputs
- Medium inputs
- Chunky inputs that push your limits
- Inputs that generate varying lengths of output
Don’t Forget About Those Adapters
Here’s a common trap: you benchmark a basic model, but then add adapters for fine-tuning in production. Surprise — those adapters add more parameters and change your performance profile!
Pro tip: do your benchmarking with adapters included, even if you just fine-tune for a few batches. Remember, we’re testing performance here, not accuracy.
Instruction Format Matters More Than You’d Think
I learned this one the hard way — using the wrong instruction format can seriously slow down your model’s response time. Each model has its preferred way of receiving instructions based on how it was pre-trained. Stick to what the model knows.
5. Mix Up Your Test Data
Your benchmark dataset needs variety. Include:
- Different input sizes
- Prompts that generate short and long outputs
- Simple and complex queries
- Different types of tasks
- Real-world examples from your use case
This way, you’ll get a much more realistic picture of how your model will perform in the wild.
Conclusion
Performance benchmarking is crucial before deploying LLMs in production — it helps you avoid nasty surprises with your infrastructure costs and ensures you can actually deliver the response times your users expect. By measuring key metrics like TTFT (Time to First Token), TPS (Tokens Per Second), and GPU usage patterns, you can make informed decisions about which GPU setup will give you the best bang for your buck.
Remember that benchmarking isn’t just about running a few quick tests — it’s about simulating real-world conditions. Use diverse input sizes, consider the impact of tokenizers and adapters, and always test with your actual use cases in mind. With the benchmarking script and approach we’ve covered, you can confidently choose the right infrastructure that balances both performance and cost for your LLM deployment.
If you enjoyed this article, your applause would be greatly appreciated!